
There has been a good deal of talk recently about gerrymandering, set off by the attempt by Texas Republicans to redistrict their state and met by threats from Democrats to respond in kind. Someone online pointed out that Massachusetts, whose governor was one of those threatening, already had no Republican representatives. Over a third of the voters are Republicans, judging by the most recent presidential election, but all nine representatives are Democrats.
That got me interested in to what extent each party had already succeeded in drawing district lines that maximized the number of representatives it elected in states it controlled. There is an easy way to produce at least a crude answer — compare the percentage of each state’s congressional delegation controlled by the dominant party to the party’s percentage of the vote.1
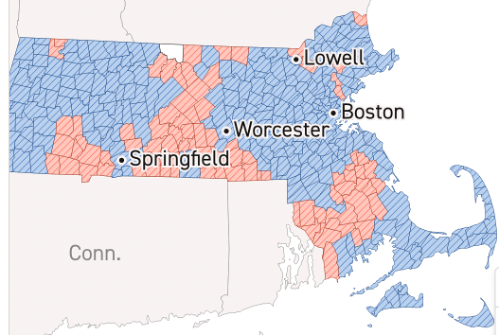
The fact that Massachusetts has no Republican representatives could just mean that Republicans are uniformly distributed across the state, giving the Democrats a two to one advantage everywhere, but as you can see from the map below, which shows who carried each town, that was not the case. The fact that the majority party in a state has a substantially larger fraction of the congressional delegation than of the voters is not proof of gerrymandering but, since the distribution of voters is rarely uniform, it is evidence of it.
The table below shows for each state how many congressional representatives it has, how many the majority party would have if the distribution of representatives was the same as the distribution of votes in the presidential election (“proportional seats” on the table), and the difference, with the color signaling the majority party. The states are ordered by the Democratic fraction of the presidential vote, from most Republican to most Democratic.
The state where the majority party is, by this criterion, most over-represented is California (Democratic), with thirteen extra seats, compared to an extra three for Texas and four for Florida (Republican).
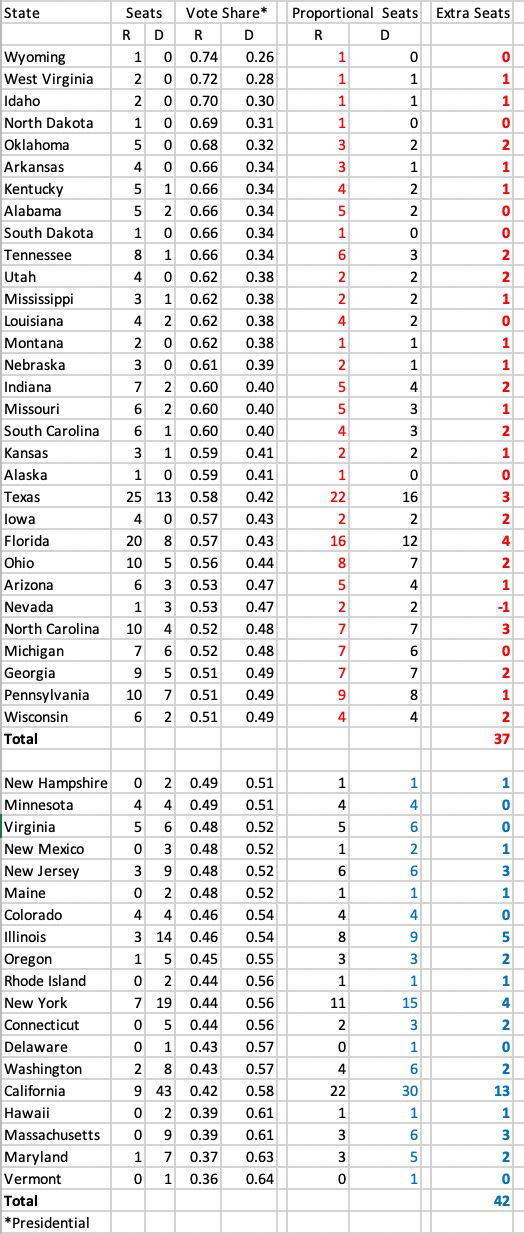
The totals show the Democrats gaining five more seats than the Republicans but that may just reflect my using the presidential vote to calculate proportional seats; my guess is that Trump did better in the election than Republican congressional candidates. It is clear, however, that the governors of California and Massachusetts are in a poor position to complain about Republican gerrymandering.
Past posts, sorted by topic
My web page, with the full text of multiple books and articles and much else
A search bar for text in past posts and much of my other writing
Ideally that would be the congressional vote but the sources I found gave that by congressional district, not state, so I used the presidential vote instead.
Gerrymandering no longer bothers me as much as it once did. I look at the example of Texas, once a solid democrat state, now more republican.
Gerrymandering is a short-term, short-sighted attempt to freeze the present into the future. It 'works' as long as the population doesn't change in composition or beliefs. But those are always changing. And the parties change as well. The Democrats of today look nothing like the party in my youth. The gerrymanders of yesterday designed to favor the Democrats in Texas failed.
As you mentioned, due to territorial districts system and non-uniformity of voters, the vote share doesn't really give us much to work with. E.g. if in some state 2/3 of people vote R and 1/3 vote D, and the state has 3 seats, is it reasonable to expect one of the Congress seats go to D? If voters are distributed uniformly, it's more reasonable to expect 0 seats to go to D, because in each of the districts they'd have only 1/3 of vote and thus lose. However, as you noted votes are not uniform - e.g. large cities are more D-leaning, rural areas are more R-leaning, etc. That's what gerrymandering relies on, however, if we want to find a "true" picture, going by vote shares won't give us that. The question is which boundaries are "true"? If we just mechanically divide the area of the state into N equi-populated pieces, I have no idea how to model what would be the result, but I am pretty sure it won't usually match the vote shares.
Of course, this all relies to the system where we have territorial districts. If we just said "everybody votes for the party, the party gets N% and gets to nominate a number of representatives according to the number of votes they won" that would make a different system entirely, which does not allow for gerrymandering. This btw is how Israel elections work - each party publishes a list, which are the potential Knesset members from this party, then people vote for the party they like, and then each party gets to fill as many seats as the percentage of votes they achieved (after rounding and discounting the parties that didn't pass the minimum vote barrier). It would require a much deeper change than just redrawing the maps though. And while we keep the territorial representation, I am not a fan of gerrymandering at all, but I don't think vote shares can really measure its effects. For the territorial map, every map is a gerrymandered map, some of them are just more blatant than others, but I don't see how one map can objectively be claimed "better" than the other. If we want to get rid of gerrymandering (and I think we do) we need some better argument that would allow us to establish how one map is better than the other - or abandon the territorial system altogether.